obspyDMT
A Python toolbox for the query, retrieval, processing and management of seismological data sets, including very large, heterogeneous and/or dynamically growing ones.
![]()
A Python Toolbox for Retrieving, Processing and Management of Seismological Datasets

![]()
![]()
obspyDMT (obspy Data Management Tool) is a tool for retrieving, processing and management of seismological datasets in a fully automatic way. Written in the Python programming language (Python 2 and 3 compatible), it can be used as a stand-alone command-line tool (requiring no knowledge of Python) or can be integrated as a module with other Python codes.
Table of contents
- Gallery
- Quick tour: run a quick tour.
- Earthquake meta-data: request event information without downloading any waveforms.
- Seismicity map
- Event-based mode: retrieve waveform data, stationXML/response files and meta-data from several different data centers.
- Update an existing data set: request the same data again (in case that part of the earlier request failed), or expand the number of earthquakes, stations, or seismograms.
- Time-continuous mode: retrieve waveforms, stationXML/response files and meta-data of waveforms that are not relative to or centered on specific earthquake occurances.
- Processing and instrument correction: process the data automatically after the data retrieval and/or on an existing data-set.
- Synthetic seismograms
- Explore station meta-data (StationXML files, filterstages):
- Speeding up data retrieval and processing by parallelization: this section introduces some options (bulk and parallel retrieving and processing) to speed-up the data retrieval and processing.
- KML format: create a KML file for event/station/ray. KML format is readable by Google-Earth.
- VTK format: create a VTK file for event(s). VTK format is readable by Paraview.
- Supported event catalogs and data centers: supported data centers and earthquake catalogs.
- Directory structure: standardized directory structure where obspyDMT organizes retrieved seismograms and metadata.
- How to cite obspyDMT
- Installation: installation and system requirements.
Gallery
Quick tour 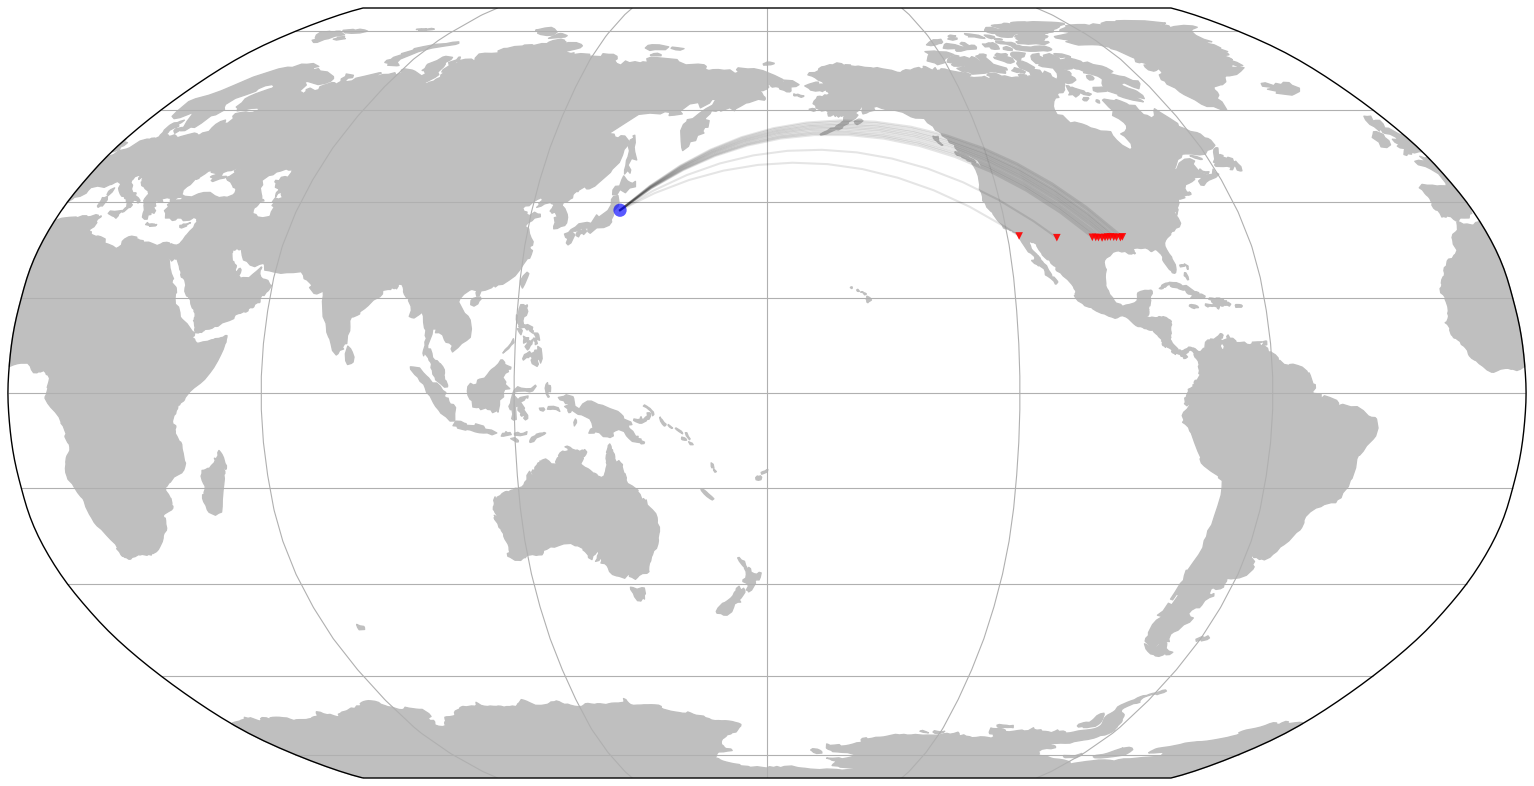 |
Earthquake meta-data 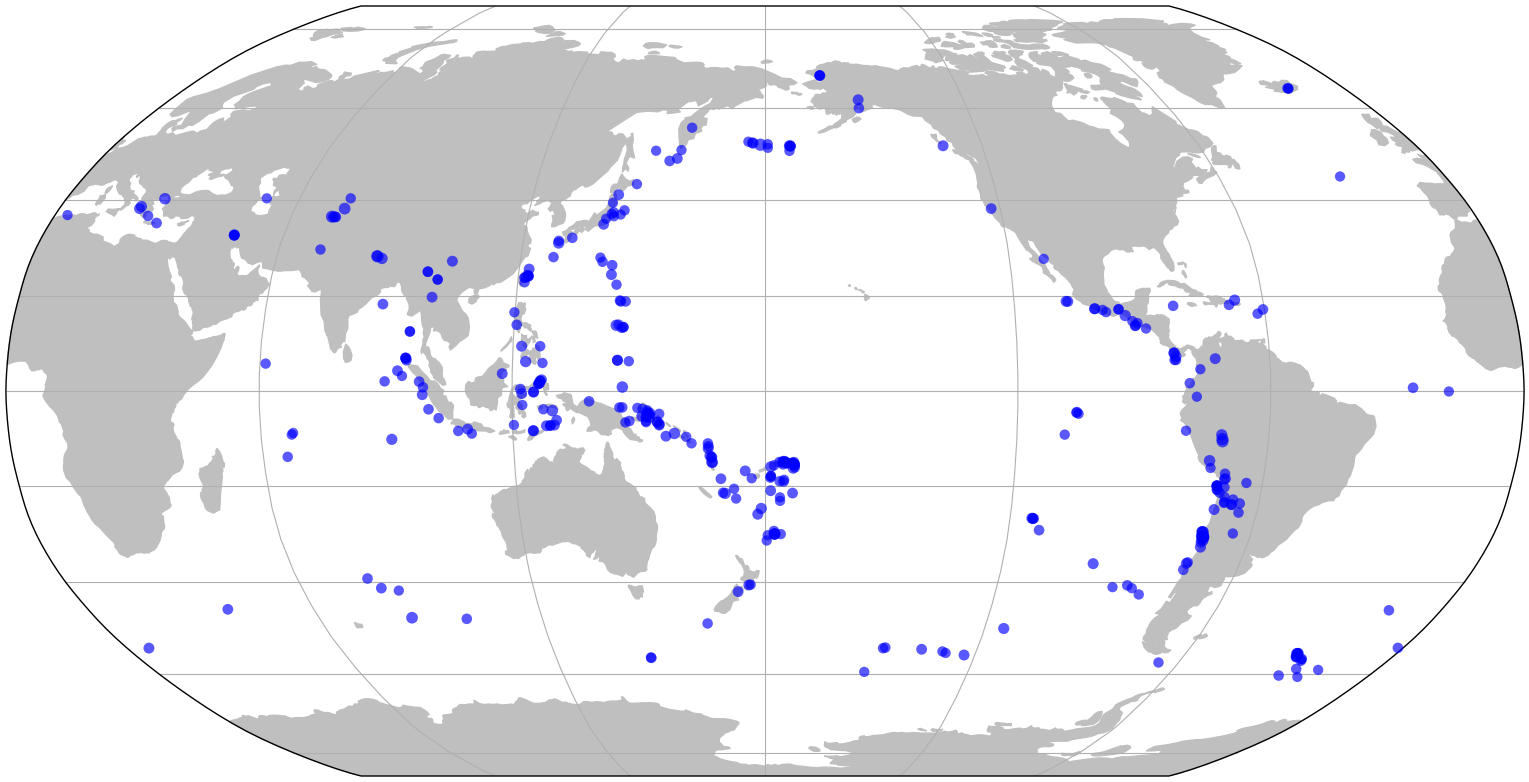 |
|---|---|
Seismicity map 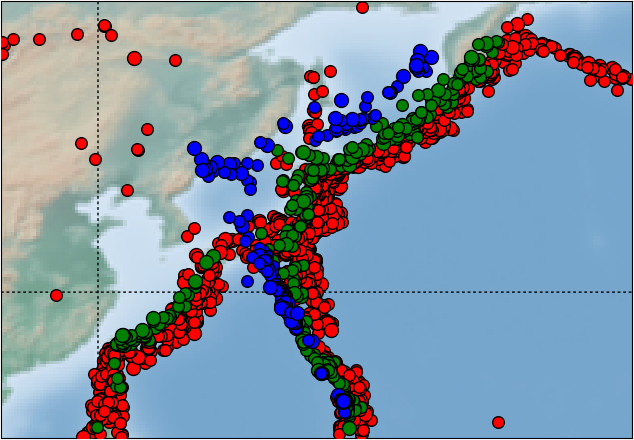 |
Event-based mode 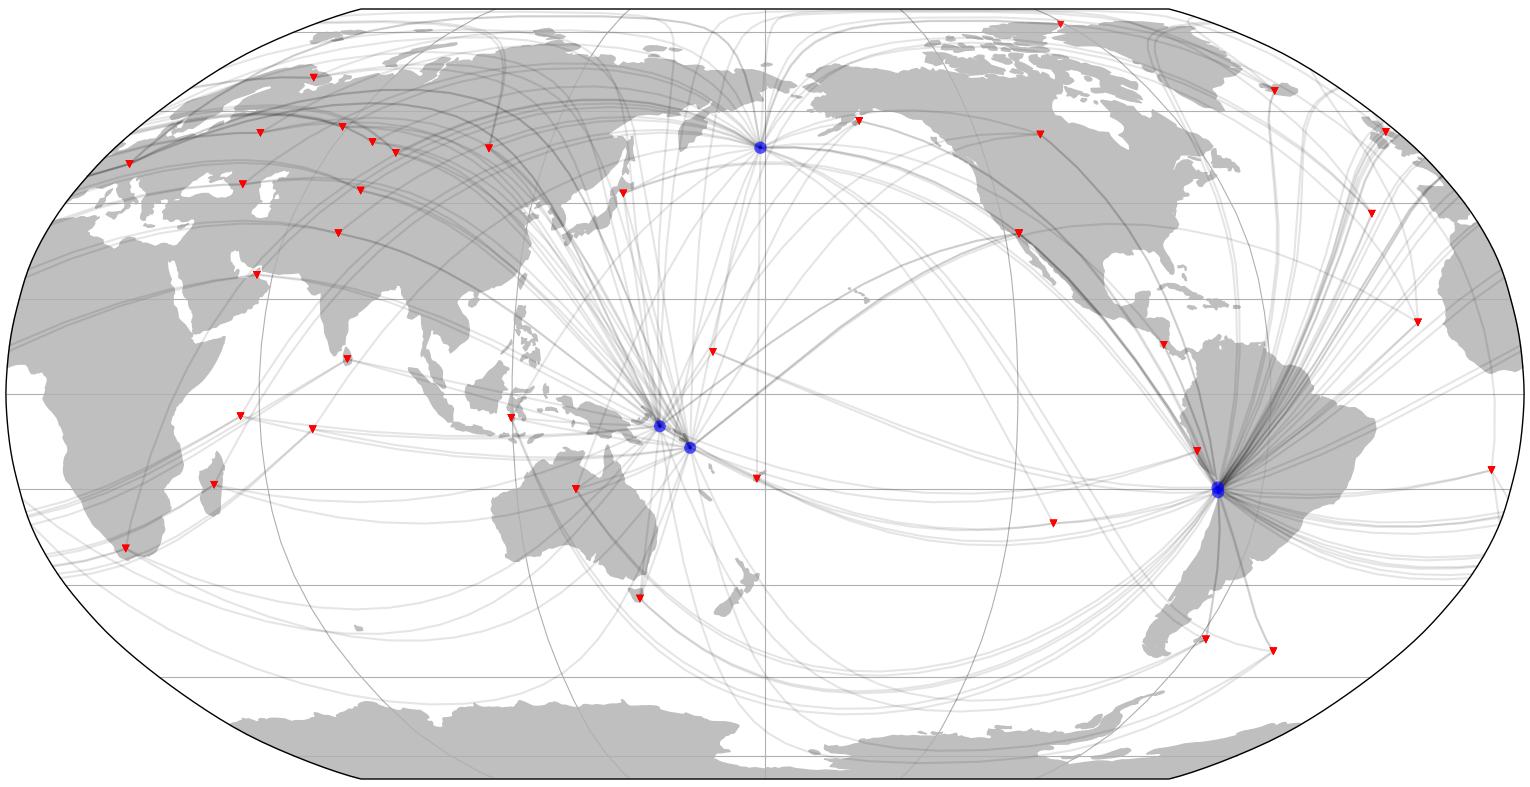 |
Update of an existing waveform data set 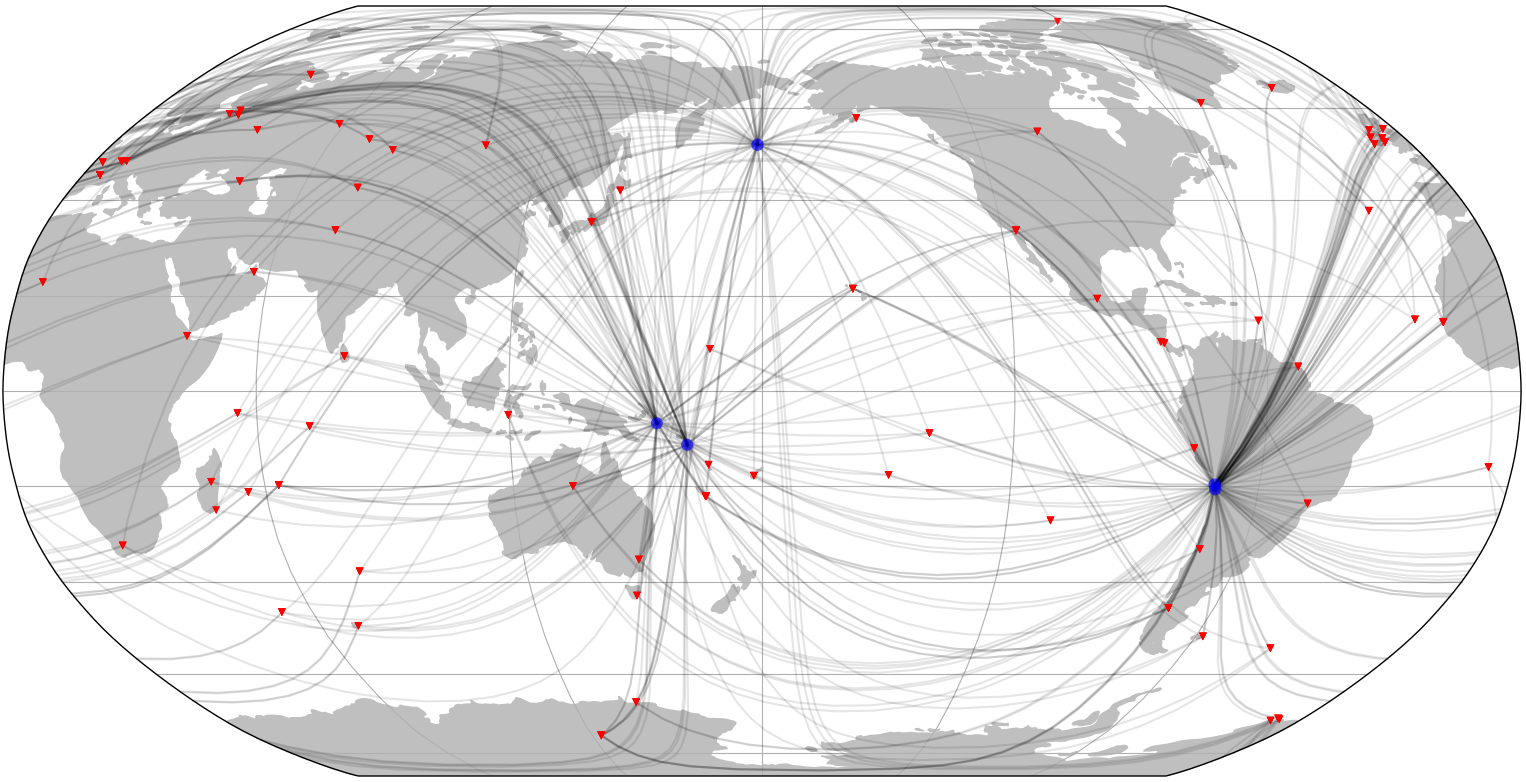 |
Time-continuous mode 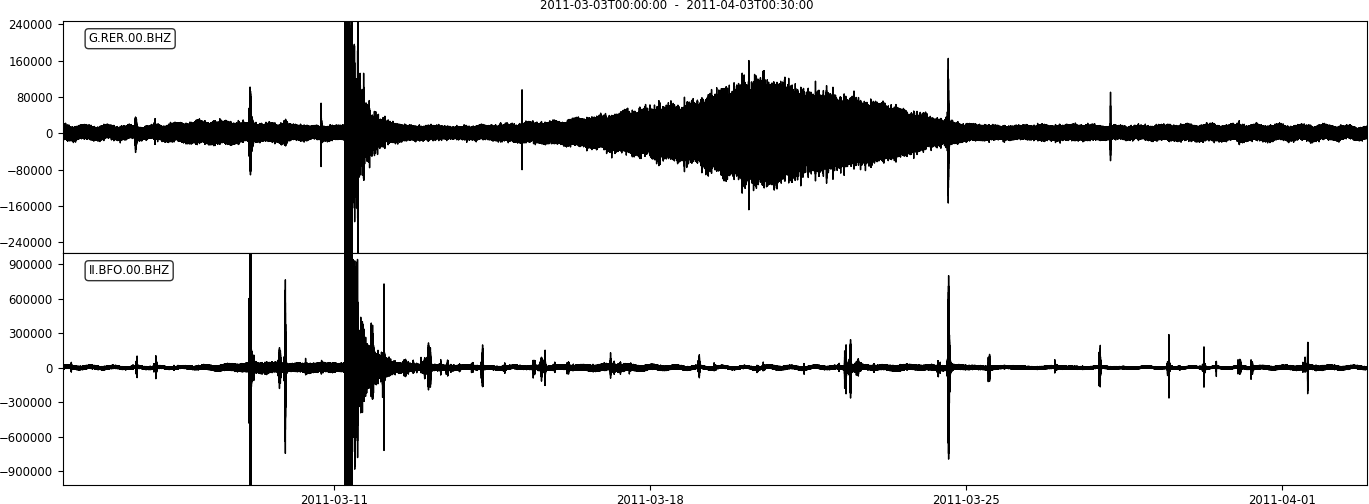 |
Processing and instrument correction 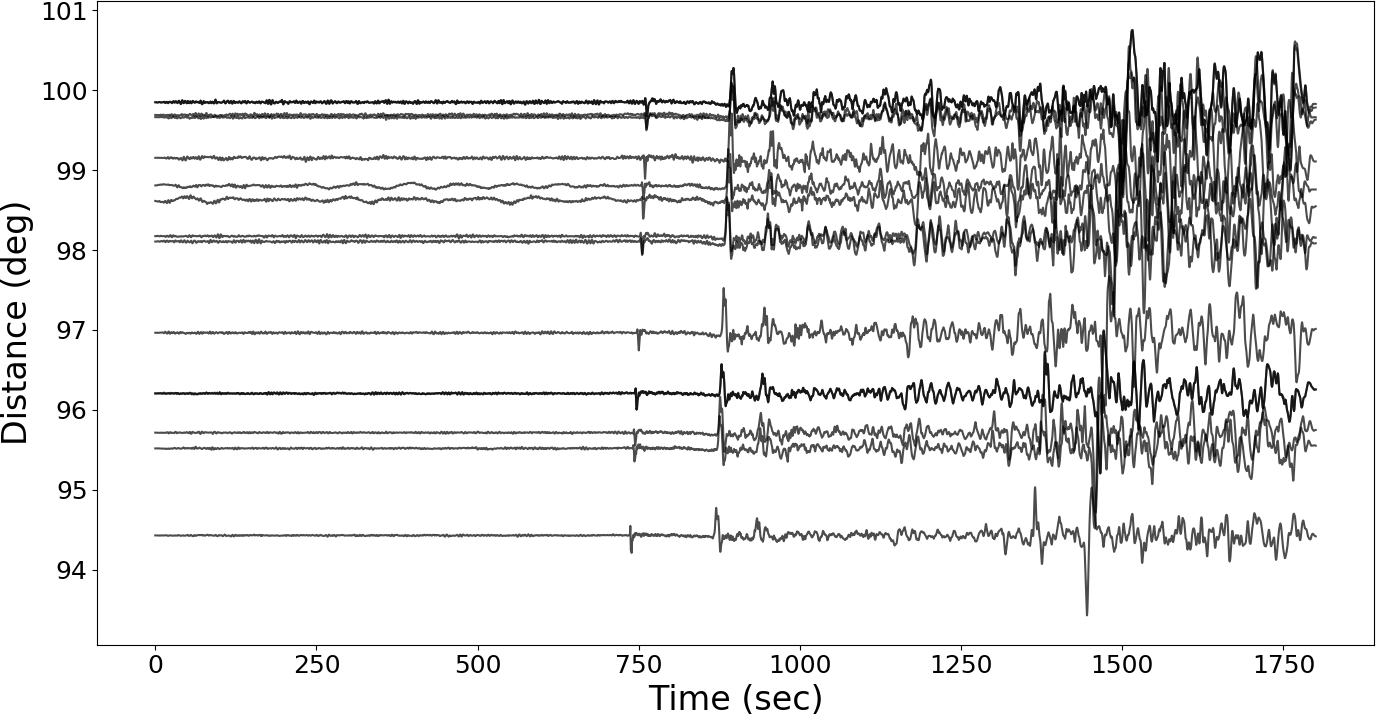 |
Synthetic seismograms 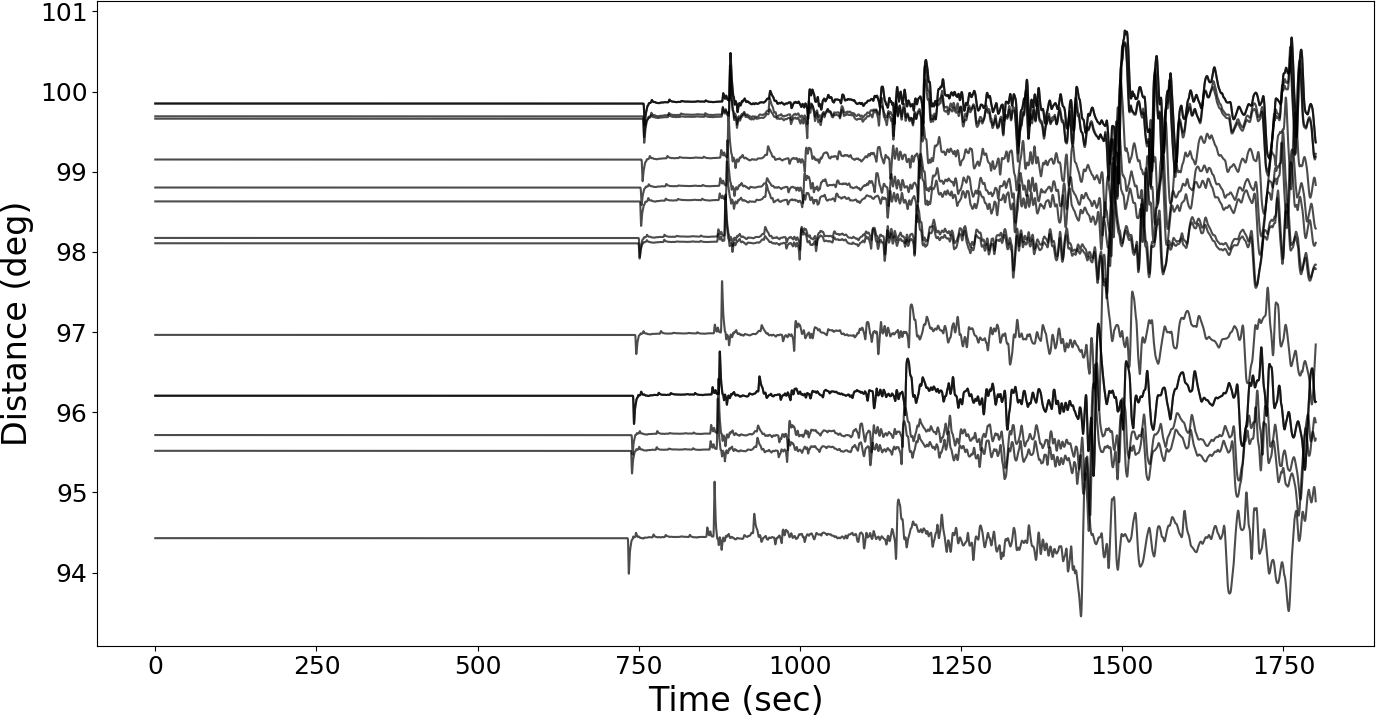 |
Explore station meta-data (StationXML files, filterstages) 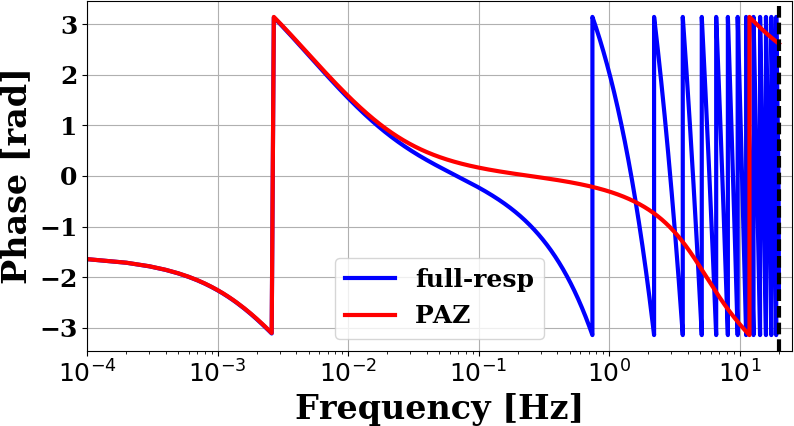 |
Speeding up data retrieval and processing by parallelization 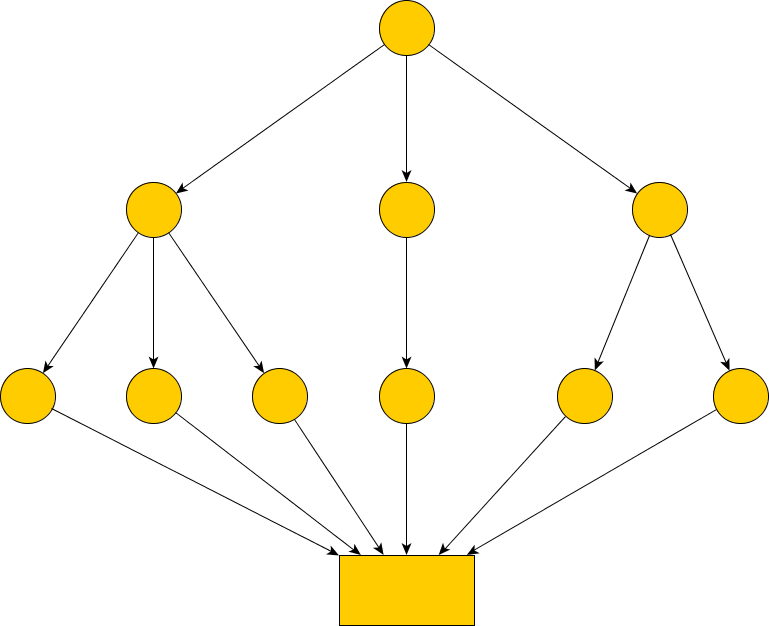 |
KML format (e.g., Google-Earth) 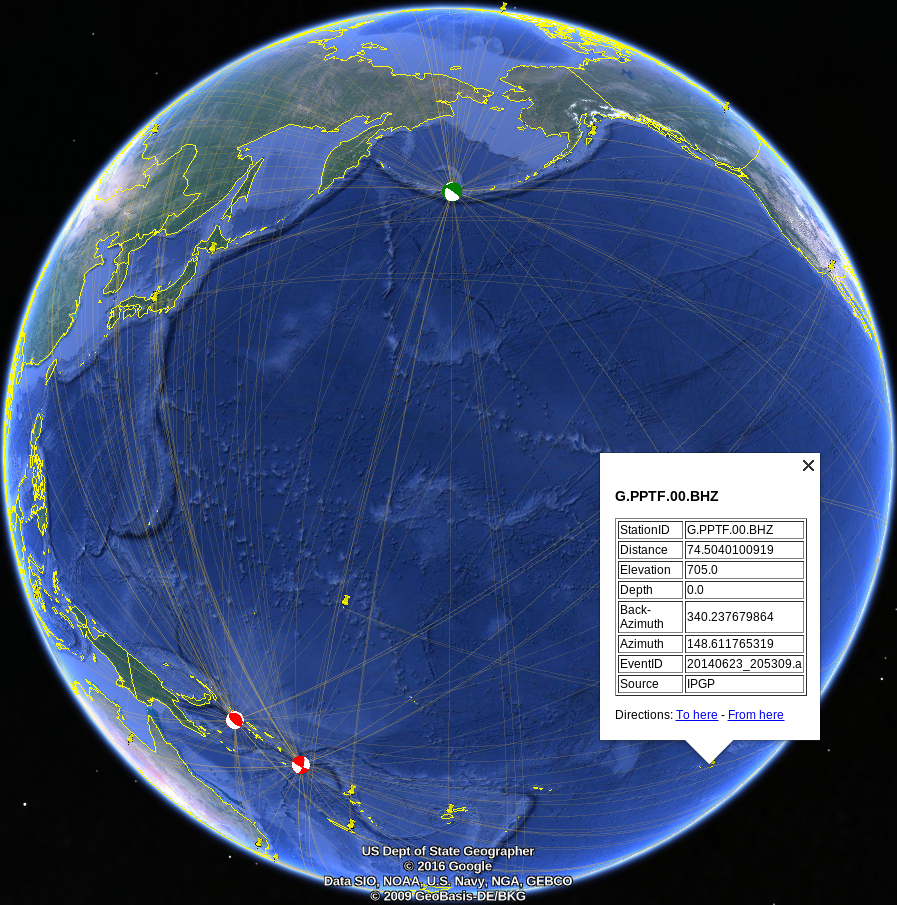 |
VTK format (e.g., Paraview) 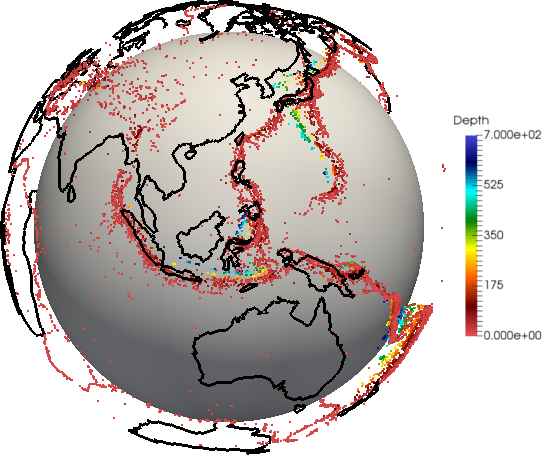 |
Quick tour
Run a quick tour:
obspyDMT --tour
dmt_tour_dir directory will be created in the current path, and retrieved/processed waveforms as well as meta-data will be organized there (refer to Directory structure section for more information).
The (raw) retrieved waveforms can be plotted by:
obspyDMT --datapath dmt_tour_dir --local --plot_waveform

To plot the processed (e.g., instrument corrected) waveforms, --plot_dir_name processed can be added to the previous command line:
obspyDMT --datapath dmt_tour_dir --local --plot_waveform --plot_dir_name processed

obspyDMT has many tools to plot the contents of a data set. As an example, the following command line plots the ray coverage (ray path between each source-receiver pair) of dmt_tour_dir directory:
obspyDMT --datapath dmt_tour_dir --local --plot_ev --plot_sta --plot_ray

Earthquake meta-data
First, we request event information from one of several supported seismicity catalogs, without downloading any waveforms yet:
obspyDMT --datapath neic_event_metadata --min_mag 5.5 --min_date 2014-01-01 --max_date 2015-01-01 --event_catalog NEIC_USGS --event_info
neic_event_metadata/ directory - created with the above command - can be updated for events that occured in 2015 of magnitude more than 5.5: (no waveform retrieval)
obspyDMT --datapath neic_event_metadata --min_mag 5.5 --min_date 2015-01-01 --max_date 2016-01-01 --event_catalog NEIC_USGS --event_info
To plot the content of local data set (neic_event_metadata/):
obspyDMT --datapath neic_event_metadata --local --plot_ev

Seismicity map
Seismicity map (--plot_seismicity option flag) of Japan region based on earthquakes of magnitude more than 5.0 that occured from 2000-01-01 until 2017-01-01 from NEIC event catalog.
Note --event_rect option flag to define a region around Japan:
obspyDMT --datapath japan_seismicity --min_mag 5.0 --min_date 2000-01-01 --max_date 2017-01-01 --event_catalog NEIC_USGS --event_rect 110./175./15/60 --plot_seismicity --event_info

Global seismicity map of archived earthquakes in NEIC catalogue with magnitude more than 5.0 that occurred between 1990 and 2016. One command queried the NEIC catalogue, stored and organised the retrieved information and generated the seismicity map. (No actual waveform data were queried in this example):
obspyDMT --datapath neic_event_dir --min_date 1990-01-01 --max_date 2017-01-01 --min_mag 5.0 --event_catalog NEIC_USGS --event_info --plot_seismicity

The results of some basic statistics (magnitude and depth histograms) are also generated and plotted automatically (top-left panel). Note the rendering of coloured beach balls in the map inset (deepest seismicity in the foreground). The global map also contains beach balls rather than just simple black dots, but they do not become apparent at this zoom level.
ISC catalog
The International Seismological Centre (ISC) provides two catalogs:
- COMPREHENSIVE bulletin contains all events collected by the ISC, including most recent events, which are awaiting review.
- REVIEWED bulletin includes all events that have been reviewed and relocated by an ISC analyst.
--isc_catalog option specifies the ISC bulletin type (default: COMPREHENSIVE). Example:
obspyDMT --datapath test_isc_comprehensive --min_date 2013-01-01 --max_date 2015-01-01 --min_mag 6.5 --event_catalog ISC --isc_catalog COMPREHENSIVE --event_info --plot_seismicity

Retrieval result for the same request using --isc_catalog REVIEWED:

Event-based mode
Here, we retrieve actual BHZ seismograms from II network that recorded earthquakes of magnitude more than 7.5 that occured from 2014-01-01 until
2015-01-01 (NEIC catalog). For this example, only stations with network code II, location code 00 and channel codes BHZ are retrieved:
obspyDMT --datapath event_based_dir --min_date 2014-01-01 --max_date 2015-01-01 --min_mag 7.5 --event_catalog NEIC_USGS --data_source IRIS --net "II" --loc "00" --cha "BHZ" --preset 100 --offset 1800
--data_source specifies that the waveform data center of IRIS should be contacted for seismograms.
Omitting this flag would trigger the default --data_source IRIS.
--preset 100 and --offset 1800 specify the retrieval of waveform time windows of 100 s before to 1800 s after the reference time.
Since we are downloading in event-based mode, i.e., centered around earthquake occurrences, the reference time defaults to the event origin time.
This could be changed to the time of P-wave arrival by invoking --cut_time_phase,
in which case each seismogram would have a different absolute start time.
To plot the stations/events/rays:
obspyDMT --datapath event_based_dir --local --plot_ev --plot_sta --plot_ray

Update an existing data set
In the course of working with a waveform data set, it often becomes necessary to update.
This could mean requesting the same data again (because part of the earlier request failed for some reason),
or expanding the number of earthquakes, stations, or seismograms.
The following command updates the data-set that we created in the previous Event-based mode section with BHZ channels of AW and E* networks (E*: all stations that their network codes start with E)
from the GFZ data center:
obspyDMT --datapath event_based_dir --data_source "GFZ" --net "AW,E*" --cha "BHZ" --preset 100 --offset 1800
Additionally, we can update the data set with BHZ channels of G* networks (i.e., all stations that their network codes start with G)
from the IPGP data center:
obspyDMT --datapath event_based_dir --data_source "IPGP" --net "G*" --cha "BHZ" --preset 100 --offset 1800
To plot the stations/events/rays:
obspyDMT --datapath event_based_dir --local --plot_ev --plot_sta --plot_ray

Time-continuous mode
In contrast to the examples of Event-based mode section and Update of an existing waveform data set,
some usage cases require waveforms that are not relative to or centered on specific earthquake occurances.
We refer to this usage mode as “time-continuous” --continuous.
For example, the following command retrieves one-month long time series (from 2011-03-03 until 2011-04-03) recorded by two stations (--sta "BFO,RER" --loc "00" --cha "BHZ") from the IRIS data center:
obspyDMT --continuous --datapath continuous_example --min_date 2011-03-03 --max_date 2011-04-03 --sta "BFO,RER" --loc '00' --cha "BHZ" --data_source IRIS

Processing and instrument correction
obspyDMT can process the waveforms directly after retrieving the data, or it can process an existing data set in a separate step (local mode).
By default, obspyDMT follows processing instructions described in the process_unit.py located at /path/to/my/obspyDMT/obspyDMT directory.
Although this file is fully customizable, several common processing steps can be done via options flags (without changing/writing new processing instructions).
The following command retrieves all BHZ channels from the IRIS data center that:
- 50 <= Azimuth <= 55 (specified by
--min_aziand--max_azi) - 94 <= Distance <= 100 (specified by
--min_epiandmax_epi) - recorded events of magnitude more than 6.8 that occured on
2014-07-21.
obspyDMT --datapath data_fiji_island --min_mag 6.8 --min_date 2014-07-21 --max_date 2014-07-22 --event_catalog NEIC_USGS --data_source IRIS --min_azi 50 --max_azi 55 --min_epi 94 --max_epi 100 --cha BHZ --instrument_correction
To plot the processed/corrected waveforms (Note --plot_dir_name processed, omitting this option would result in plotting raw counts, i.e., --plot_dir_name raw):
obspyDMT --datapath data_fiji_island --local --plot_waveform --plot_dir processed

Synthetic seismograms
obspyDMT can retrieve synthetic waveforms matching the real data using Syngine webservice.
The following example command retrieves not only observed waveforms but also their synthetic counterparts, computed on an IASP91 background model (note --syngine --syngine_bg_model iasp91_2s):
obspyDMT --datapath data_fiji_island --min_mag 6.8 --min_date 2014-07-21 --max_date 2014-07-22 --event_catalog NEIC_USGS --data_source IRIS --min_azi 50 --max_azi 55 --min_epi 94 --max_epi 100 --cha BHZ --instrument_correction --syngine --syngine_bg_model iasp91_2s
To plot the synthetic waveforms (note --plot_dir_name syngine_iasp91_2s):
obspyDMT --datapath data_fiji_island --local --plot_waveform --plot_dir_name syngine_iasp91_2s

Explore station meta-data (StationXML files, filterstages)
obspyDMT implements several plotting options to explore station meta-data.
For example, the following command generates a visual representation of transfer function spectra (amplitude and phase) of IC.XAN station in China.
Blue lines show transfer function components computed for all filter stages in the StationXML file;
red lines are for the analogue part.
obspyDMT --datapath /path/to/STXML.IC.XAN.00.BHZ --plot_stationxml --plotxml_paz --plotxml_min_freq 0.0001

To plot transfer function spectra (amplitude and phase) of GT.LBTB station in Botswana:
obspyDMT --datapath /path/to/STXML.GT.LBTB.00.BHZ --plot_stationxml --plotxml_paz --plotxml_min_freq 0.0001

Transfer function spectra (amplitude and phase) of each stage in the StationXML file can be also plotted by (note --plotxml_allstages):
obspyDMT --datapath /path/to/STXML.GT.LBTB.00.BHZ --plot_stationxml --plotxml_min_freq 0.0001 --plotxml_allstages

In the phase response, two stages (1 and 5) have non-zero values.
Speeding up data retrieval and processing by parallelization
To increase the efficiency in retrieving waveform data, a functionality for parallelized data retrieval can be enabled as follows:
--req_parallel --req_np 4
The second flag (--req_np 4) specifies the number of parallel requests.
A further speed-up can be achieved by specifying a bulk request. Instead of requesting individual items, this will send a list of items (time series or meta data) to the data center:
--bulk
To enable parallel processing with, for example, 10 threads:
--parallel_process --process_np 10
KML
Take the example of Event-based mode section. To create a KML file (readable by Google-Earth) based on that data set:
obspyDMT --datapath event_based_dir --local --plot_ev --plot_sta --plot_focal --plot_ray --create_kml

or to plot events of magnitude more than 7.0 in the global example of Seismicity map section:
obspyDMT --datapath neic_event_dir --local --plot_ev --plot_focal --min_mag 7.0 --create_kml

VTK
Take the global example of Seismicity map section. To create a VTK file (readable by Paraview) for all events in that data set:
obspyDMT --datapath neic_event_dir --local --create_event_vtk

Supported event catalogs and data centers
Print supported data centers that can be passed as arguments to --data_source:
obspyDMT --print_data_sources
Print supported earthquake catalogs that can be passed as arguments to --event_catalog:
obspyDMT --print_event_catalogs
Read an existing local event catalog
--read_catalog <PATH> option flag reads in an existing event catalog located at <PATH> and proceeds.
Currently supported catalog metadata formats: “CSV”, “QUAKEML”, “NDK”, “ZMAP” (Refer to obspy documentation for details on QuakeML, NDK and ZMAP formats).
CSV format: obspyDMT can read a CSV file as an event catalog. This must be a list of comma-separated values containing some or all of the fields below, one event per line:
event_number,event_id,datetime,latitude,longitude,depth,magnitude,magnitude_type,author,flynn_region,mrr,mtt,mpp,mrt,mrp,mtp,stf_func,stf_duration
File catalog.txt, generated by obspyDMT in EVENTS-INFO subdirectory provides an example of such a file.
Example:
#number,event_id,datetime,latitude,longitude,depth,magnitude,magnitude_type,author,flynn_region,mrr,mtt,mpp,mrt,mrp,mtp,stf_func,stf_duration
1,20110311_054623.a,2011-03-11T05:46:23.200000Z,38.2963,142.498,19.7,9.1,MW,None,NAN,None,None,None,None,None,None,triangle,164.914
datetime, latitude, longitude, depth and magnitude are mandatory. Optional fields may be set to None, as in the following example where only datetime, latitude, longitude, depth and magnitude are set:
#number,event_id,datetime,latitude,longitude,depth,magnitude,magnitude_type,author,flynn_region,mrr,mtt,mpp,mrt,mrp,mtp,stf_func,stf_duration
1,None,2011-03-11T05:46:23.200000Z,38.2963,142.498,19.7,9.1,None,None,None,None,None,None,None,None,None,None,None
Directory structure
For each request, obspyDMT creates the depicted directory tree inside the user-specified directory datapath/, and arranges the retrieved data either in different event directories (for event-based requests) or in chronologically named directories (for continuous requests). It also creates a directory in which a catalog of all requested events/time spans is stored. Raw waveforms, StationXML/response files and corrected waveforms are collected in sub-directories. While retrieving the data, obspyDMT creates metadata files such as station/event location files, stored in the info/ directory of each event.

How to cite obspyDMT
Please consider acknowledging obspyDMT if it helps you to obtain results and figures for publication or presentation, by citing:
Hosseini, K. and Sigloch, K.: ObspyDMT: a Python toolbox for retrieving and processing large seismological data sets, Solid Earth, 8, 1047-1070, https://doi.org/10.5194/se-8-1047-2017, 2017.
Installation
:warning: Python versions >= 3.7 are recommended.
We strongly recommend installation via Anaconda (refer to Anaconda website and follow the instructions).
- Create a new environment for obspyDMT
conda create -n py38dmt python=3.8
- Activate the environment:
conda activate py38dmt
- 🗺️ For plotting data on maps, we use Cartopy. If you don’t want to plot data on maps, you can skip this step.
conda install -c scitools cartopy
- 🌏 To create KML files (readable by Google-Earth), we use PyKML. If you don’t want to create KML files, you can skip this step.
pip install pykml
-
obspyDMT can be installed in different ways:
-
Install obspyDMT via PyPi (which tends to be the most user-friendly option):
- Install obspyDMT:
pip install obspyDMT -
Install obspyDMT from the source code:
- Clone obspyDMT source code:
git clone https://github.com/kasra-hosseini/obspyDMT- Install obspyDMT dependencies:
 cd /path/to/my/obspyDMT
 pip install -v -e .
-
obspyDMT can be used from a system shell without explicitly calling the Python interpreter. The following command checks the dependencies required for running the code properly:
obspyDMT --check
obspyDMT contains various option flags for customizing the request. Each option has a reasonable default value, which the user can change to adjust obspyDMT option flags to a specific request. The following command displays all available options with their default values:
obspyDMT --help
The options are grouped by topics. To display only a list of these topic headings, use
obspyDMT --options
and to see the full help text for only one topic (e.g., group 2), use
obspyDMT --list_option 2